I use the lower body model for a gait analysis. To model several trials at once, I use Python (Spyder) and then load the H5-Files into Matlab and evaluate them there.
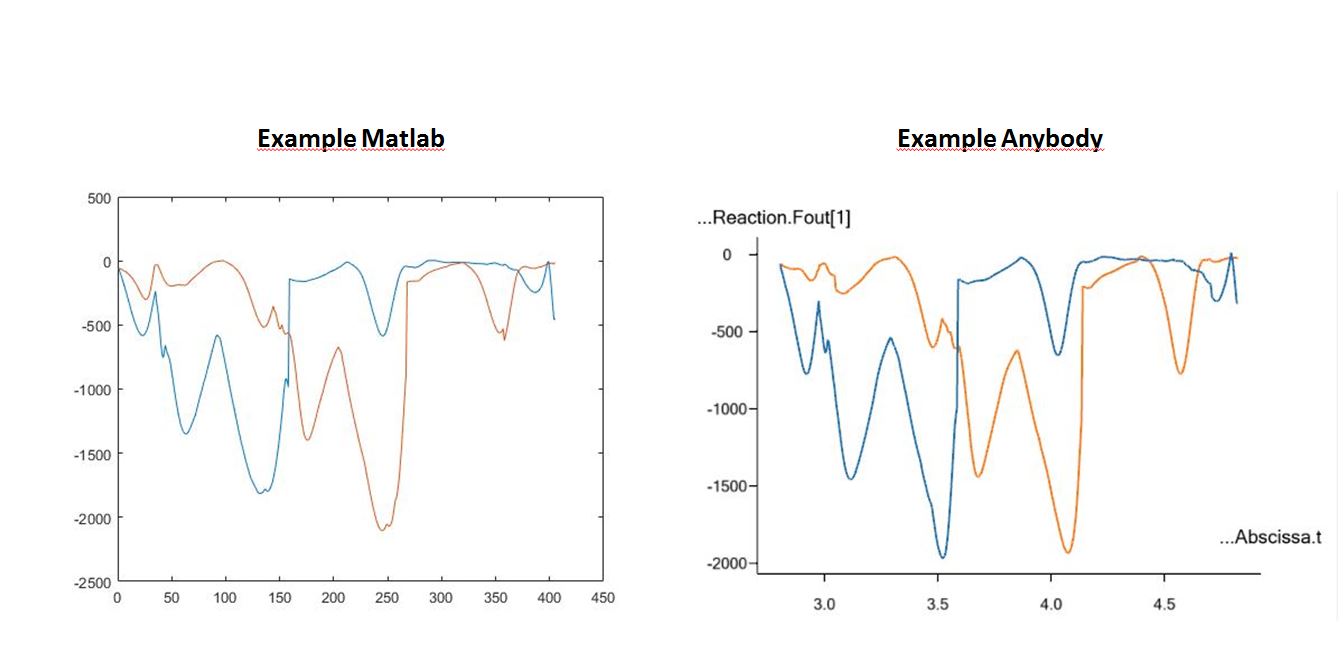
Now I noticed that the datas, which can be seen directly in Anybody (e.g. knee contact forces) are slightly different from the ones, which can be seen in Matlab.
What could be the reason for this? Could this possibly have something to do with Python?
Most likely you are not comparing the same curves or there was a change in the code. I can see that the blue and yellow peaks are close to each other in the AnyBody example, but there is a gap in the Matlab case. Could it be that you are using some sort of curve filtering that could changes curves? Otherwise I don't see why two curves should be different.
So I found out, the problem is not with Matlab but with Python. I use Python (Spyder) to do a multi-file analysis, i.e. the inverse analysis is done for several trials at once. Here the h5 outputs change slightly.
Unfortunately there is still too little information for me to help you. If you load the same data and do exactly the same analysis you should get the same results. So if something is different - it basically means that either the data is not consistent or the processing is not identical. Could it be that you overwrite your H5 file when you run a multitrial analysis? And then comparing with Matlab do not see the result?
Please try describe the process or potentially show the script that you use for us to spot the problem.
Another problem could be that your GUI version of AMS does not correspond to the console version used by Python. Could you check versions of AnyBody.exe vs AnyBodyCon.exe?