Answer 1:
yes it does, it is a list which has been created by searching for all muscles in the spine.
Answer 2.
yes but it may not be super easy to use this list. … there are easier ways.
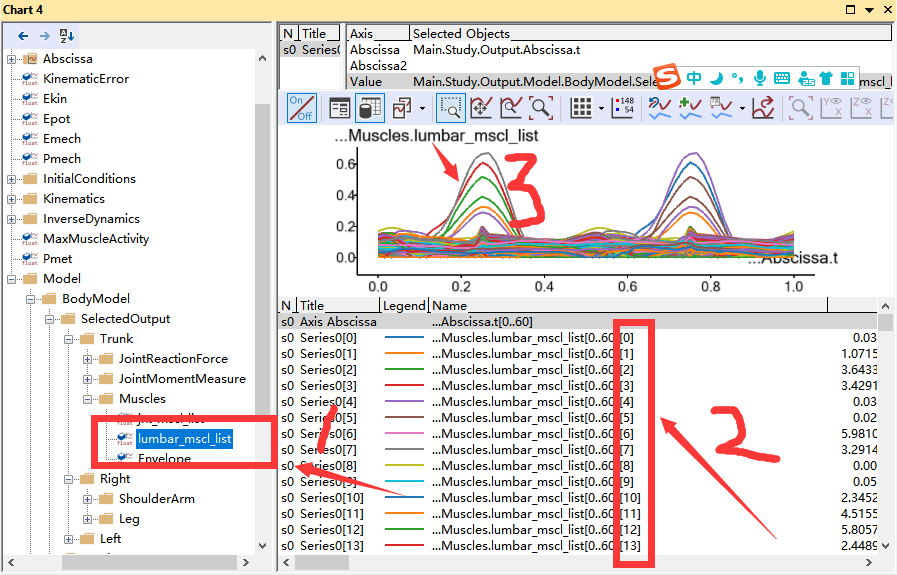
This list of muscle are a step on the way to make the envelope curve, to make the envelope curve we first search out the muscles this gives the list , then we take the max of the list.
Unfortunately if you look at the list and plot this there is no easy way to get the name out of a specific curve.
The best you can do is to find the muscles in trunk model folder and plot them. See e.g. this link on how to do this
Note that you need to navigate to the human model Trunk folder and find the folders containing the muscles then add “*” to plot multiple muscles in the chart.
3: If you plot using the approach above it will give you directly the names.
.
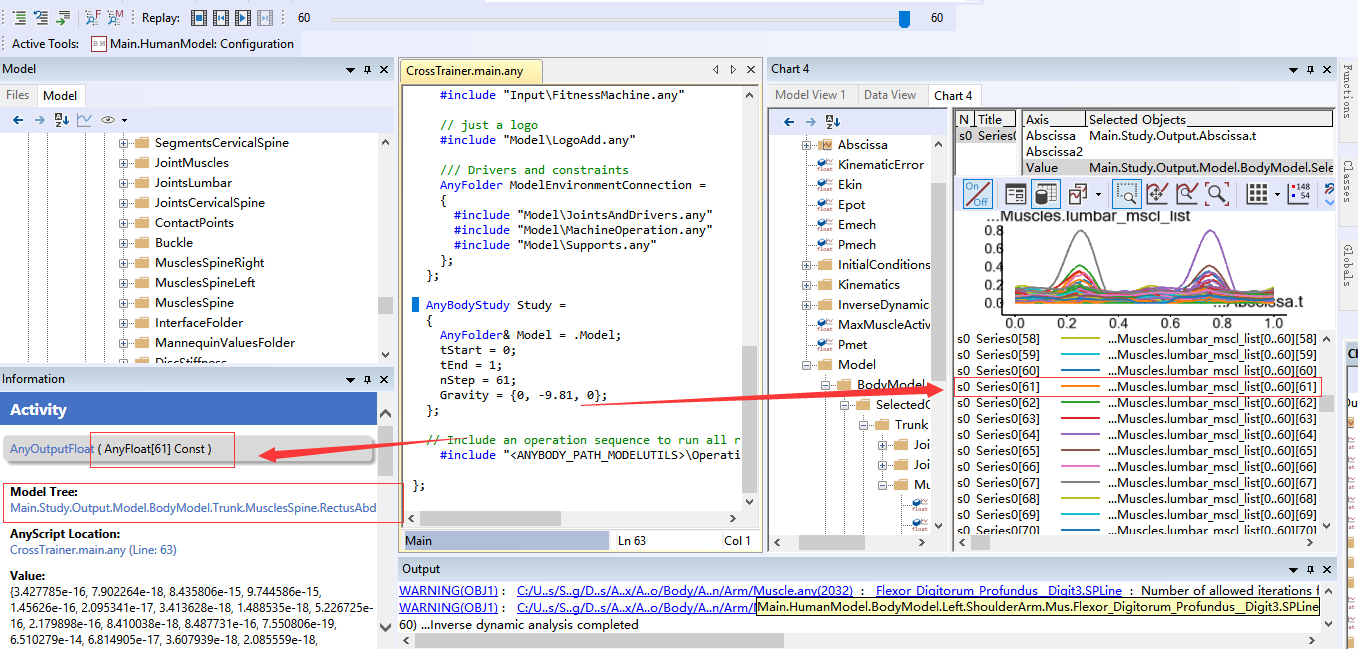
1.Excuse me, is the content of the box on the left and the content on the right side of the box consistent? There is a muscle name below the box on the left. Can I determine the name of the muscle in this way?
2.When I look at the rectus abdominis muscle activity is expressed as a percentage, but when looking at other muscle activity, it is numerically represented. What is going on?
I think you might have missed the last part of the tutorial which shows how to add Asterix in form of the sign “*” to display multiple items of e.g. a muscle.
Id you click one muscle e.g.
Back to your questions:
1: No, this is unfortunately not directly possible from the GUI, it is possible but only through writing some extract small script which picks out e.g. element 50 from the muscle name list and display its name. The 61 displayed on rectus muscle has nothing to do with the 61 in the plot, this is a coincidence, the 61 in the rectus muscle is there because the study has 61 steps, which means all output variables will have this dimension, so if you click any muscle you will see 61.
2: all muscle activations are numerically represented, if a muscle activation is 1 it means it is 100% active and it is working at its limit, many muscles will have activations around zero with a very low number( i am not sure i understood this question)